For the past 10 years, my friend Loren McDonald (formerly of Silverpop, now an Evangelist at IBM’s Watson Marketing division) has authored an annual email benchmark report, looking at how email programs from different types of company fare around the world.
The 2018 edition of the Email and Mobile Metrics Marketing Benchmark Report is out, and it’s a doozy. This comprehensive guide turns over every rock to show you how you compare to your peers with regard to open rate, click through rate, click-to-open rate, unsubscribe rate, and other metrics associated with push notifications and SMS messaging.
The report includes results from Watson Marketing customers in 40 countries, and across 20 industries.
If you send email AT ALL for business, I very much suggest you download the report. But, I know that some of you don’t want to flip through a 51-page PDF. That’s why Loren and I partnered on a recent Webinar where we summarized the key findings.
If you send email AT ALL for business, I very much suggest you watch the Webinar replay. But, I know that some of you don’t want to sit through a 60-minute Webinar, even though Loren and I got into some deep exchanges about what the data means, and how marketers should apply it to their own marketing.
So, I’ve also created this article that summarizes the most important data in the 2018 Email Benchmark Report, with five questions you may want to ponder when thinking through your email strategy and frequency.
Question 1: What Will Happen to Open Rates in the USA and Europe, Now That GDPR is a Thing?
The Email Benchmark Report finds that open rates vary significantly by region. The average open rate for a Watson Marketing customer in Canada, for example, is 38%, whereas it’s just 17% in Latin America.

Loren and I believe this is, in part, due to Canada’s adoption a few years ago of the CASL (Canadian Anti-Spam Legislation) provisions, which created better email list hygiene nationally. Today, if Canadians get sent an email by a brand, it’s more likely that it’s an email they truly want. That is less true in other regions.
We feel confident that we will see a similar scenario unfold in the USA and Europe, and open rates for emailers that have cleaned up their lists due to GDPR will see a bump upward in average open rate, since inactive subscribers are likely to have been purged to some degree.
Question 2: Are Open Rates Correlated with Company Type?
It appears that this is at least partially true.
The Email Benchmark Research Report finds that open rates vary significantly by industry. For example, automotive companies see an average open rate of 45%, whereas consumer services companies average just a 15% open rate.
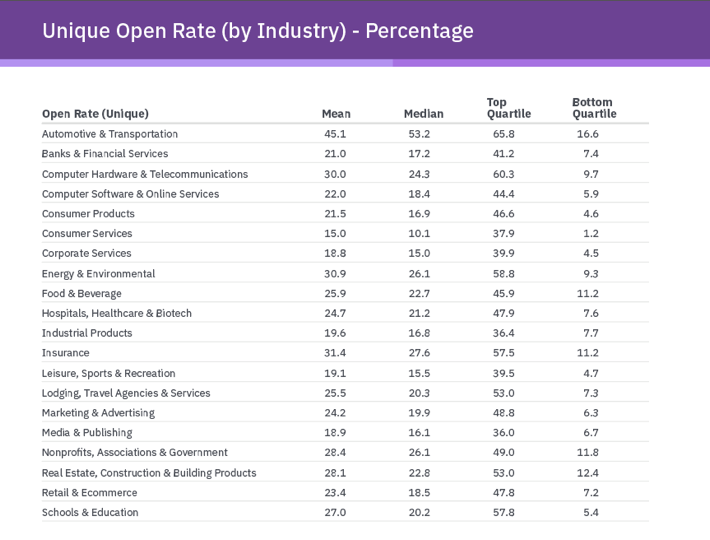
Since other high-performing industries include Insurance, Telco, Non-profits, and Energy the assumption is that the role the company (or company type) plays in your life contributes to the likelihood that subscribers will (or will not) open emails consistently.
If your insurance company sends you an email, you’ll probably open it. If your television provider does, perhaps you won’t. It’s a matter of stakes and urgency.
Email open rates vary significantly by industry. For example, automotive companies see an average open rate of 45%, whereas consumer services companies average just a 15% open rate. #WatsonMarketing Share on X
Question 3: Average Open Rates are Very Low for Some Industries. Should They Change Their Strategy?
Maybe. But understand this: every email program is a three-legged stool. Those legs are strategy, execution, and list quality.
- Strategy is what you are sending, to whom, and why?
- Execution is when do you send, who is the email from, and how are the emails written and designed?
- List quality covers who is on your list, how did they get there, and what do they expect?
When trying to improve any email program, you must always test and optimize from the bottom up. The first area of inquiry must always be list quality. If your list is comprised of people who were added 10 years ago, or people who were added when they threw their business card into a fishbowl or something, you aren’t likely to have a fantastically effective email program. It’s just not a fresh, engaged audience.
The second area of inquiry is the execution. This is where you do your heavy testing. From line. Subject line. Time of day. Day of week. Design. Clickable links.
Lastly, if the list quality is decent, and you’ve tested all the execution components, and you still can’t get good results, it may be time to reexamine the fundamental approach and strategy.
Question 4: Why Don’t Open Rates Correlate with Click-to-Open Rates?
A note first on definition. Open Rate measures the percentage of total subscribers that see or “open” your email. Click-to-Open Rate measures the percentage of people who open the email that subsequently click one or more links in the email.
And it’s manifestly true that these numbers are wildly disparate. For example, automotive companies have an average open rate of 45%. Yet, their click-to-open rate is just 13%. Leisure, sports, and recreation companies see an average open rate of just 19%, but their click-to-open is 17%.
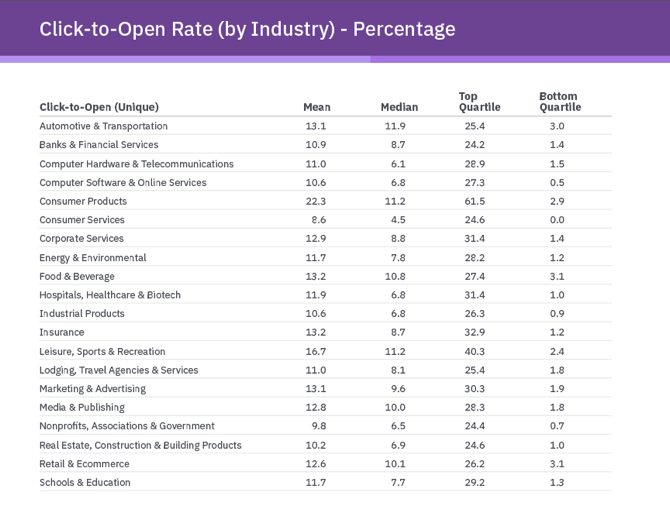
In fact, it’s possible for a brand to have a higher click-to-open rate than open rate. How? And why do the numbers differ so much?
It’s because these data points measure entirely different things, despite their confusingly similar names. Open rate measures how effective the PROMISE of the email is. All you see as a subscriber is from name and subject line. That, plus your historical relationship with the company is what determines whether you’ll open that email.
Click-to-open rate measures how effective the CONTENTS of the email are. Once opened, subscribers see the text, graphics, submit buttons, and everything else contained in that message.
Of course, the ideal is to have both rates be high, but if clicks are what you seek (and that’s not always true), I’d pay more attention to click-to-open rate vs. open rate.
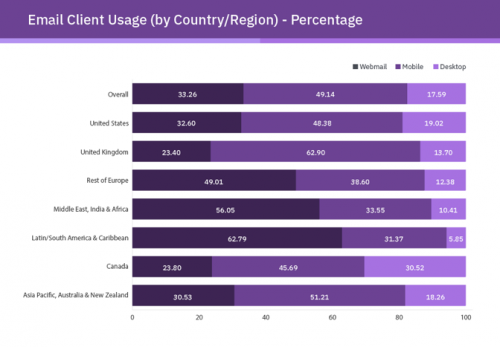
Question 5: How Can We Make Emails More Mobile-Friendly?
The Email Benchmark Research Report 2018 includes statistics that show that more and more subscribers are reading emails on a mobile device. In fact, in the United Kingdom, almost two-thirds of all emails sent by Watson Marketing companies are consumed on a mobile device.
In the United States, 48% of emails are currently consumed on a mobile device, according to this research.
A few tips to make your emails more effective for mobile devices.
- First, keep your subject lines short. They get cut off after just a couple dozen characters, depending upon which email client a subscriber is using on their smartphone.
- Second, keep the email itself short. Nobody likes to scroll and scroll and scroll and scroll.
- Third, use big, bold images to capture attention immediately.
On the Webinar, Loren talked about an example he uses in presentations where he shows a picture of himself in front of the Taj Mahal. He shows it for just a few seconds, and then asks the audience to describe what they saw. Then, he shows a slide that includes a two sentence description of him at the Taj Mahal. It takes the audience a LOT longer to process and understand when they have to read.
The same is true in your email. It’s better if you can show it, instead of saying it.
I hope this glimpse into 2018 Email Marketing Research helps you improve what you’re sending, to whom, and when. Don’t forget to grab the free report, as well as the Webinar replay.