
When solving tough growth challenges, B2B marketers often turn to Google Analytics. For measuring activity and addressing questions that are answered only with data, GA is the industry standard. The problem is, many marketers look to the surface for insights that are mistakenly considered gospel.
Indeed, only 22 percent of marketers believe they run data-driven marketing initiatives that are achieving significant results. And I’d bet the other 78 percent are only scraping the tip of the analytics iceberg. But there are three advanced features you can use to generate real, granular insights from your analytics.
1. Advanced Segmentation
Google Analytics provides a whole range of useful insights out of the box. But without digging deeper, you’re not getting the full picture.
Many marketers make the mistake of taking basic reports at face value. If you’re serious about conversion optimization and growth, you need to segment your reporting. Thankfully, GA has an advanced segments feature that assists you in getting the most out of the platform. With it, it’s easy to create custom segments and reports based on demographic, technology, behavior, date, and traffic sources.
Why use segments? It opens up a whole host of benefits, including:
- The ability see all data and reports (including custom) for users by criteria.
- Include demographic data within your reports.
- Access and import segments developed by the Google team and other GA users.
Getting Started with Segmentation
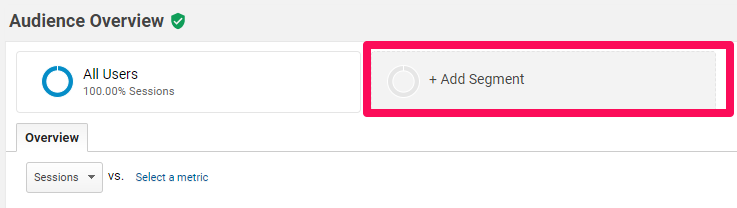
To add new segments, make sure you’re under the Audience overview, and click on “+Add Segment”:
You’ll see the following list of default segments provided by GA:
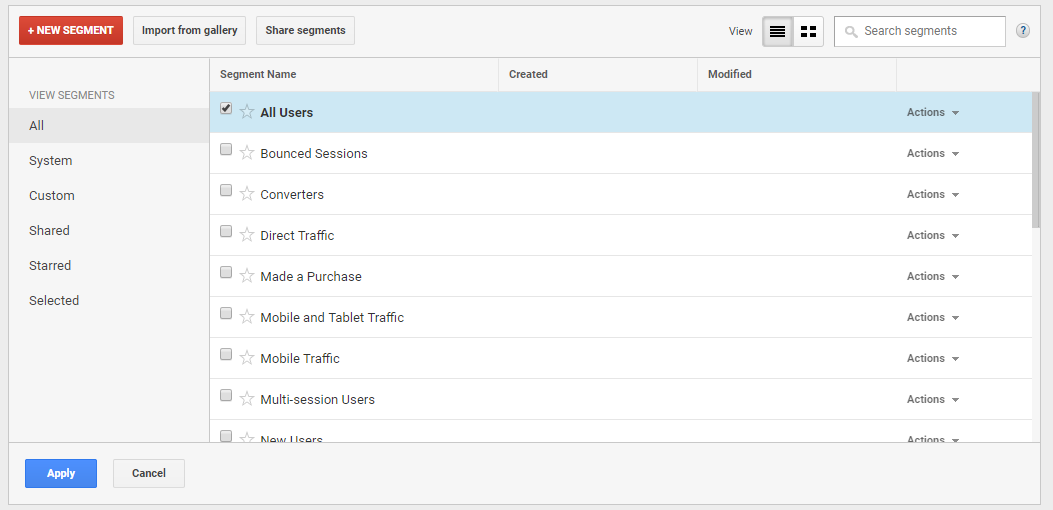
There are many options, all of which have their uses. In this example, I’ve selected some traffic segments to compare different sources:
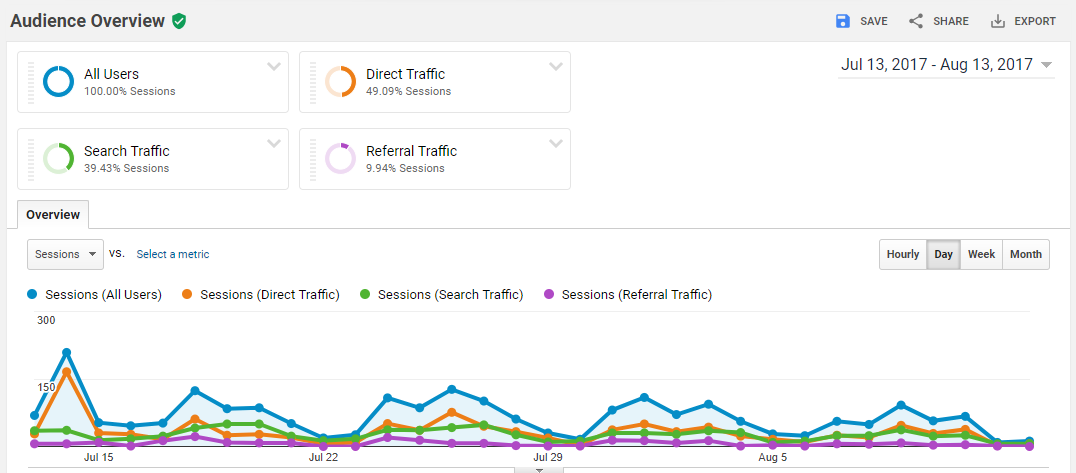
I now have a complete overview of performance by traffic source. I can see Session, Users, Average Session Duration, and Bounce Rate metrics for each source in one place, which shows you how different channels perform.
Experiment with different default segment options to become more familiar with the feature. Dig deep into the insights that solve your business challenges.
So, now you understand the power of segments. But we’ve only just scratched the surface. To get the most out of this feature, let’s dive into custom segments.
The Power of Custom Segments
Sure, Google Analytics has some useful default segments you can use. But the real power comes in the form of custom audiences.
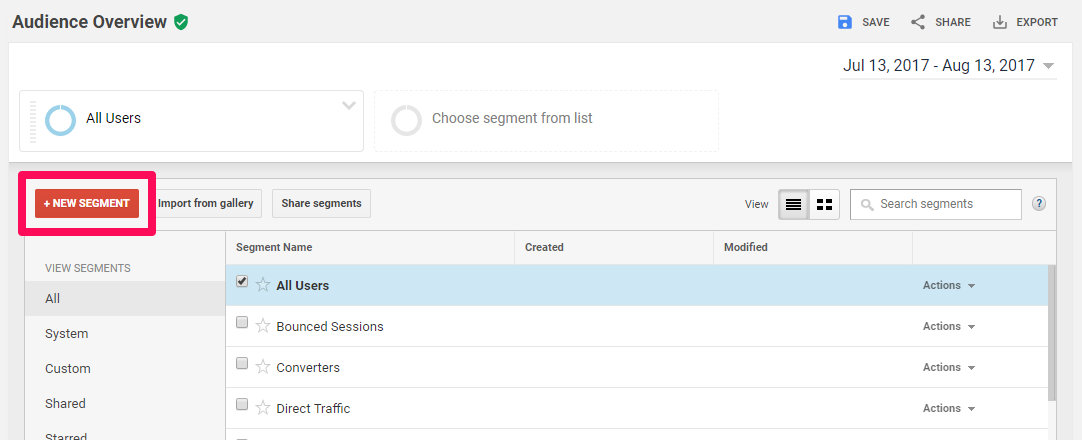
To create a custom segment, click the “+Add Segment” button from earlier and click the “New Segment” button:
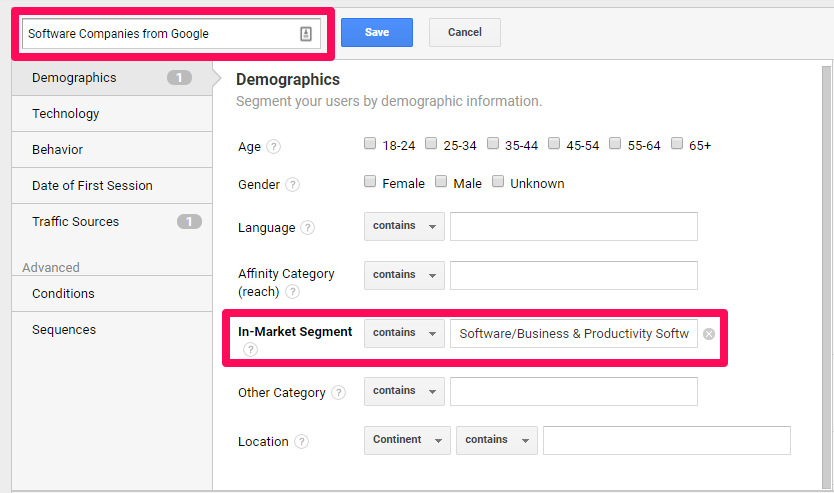
In this example, I’m going to create a segment called “Software Companies from Google” (under the Segment Name text box). I’ll then select Demographics > In-Market Segment > (contains) Software/Business & Productivity Software:
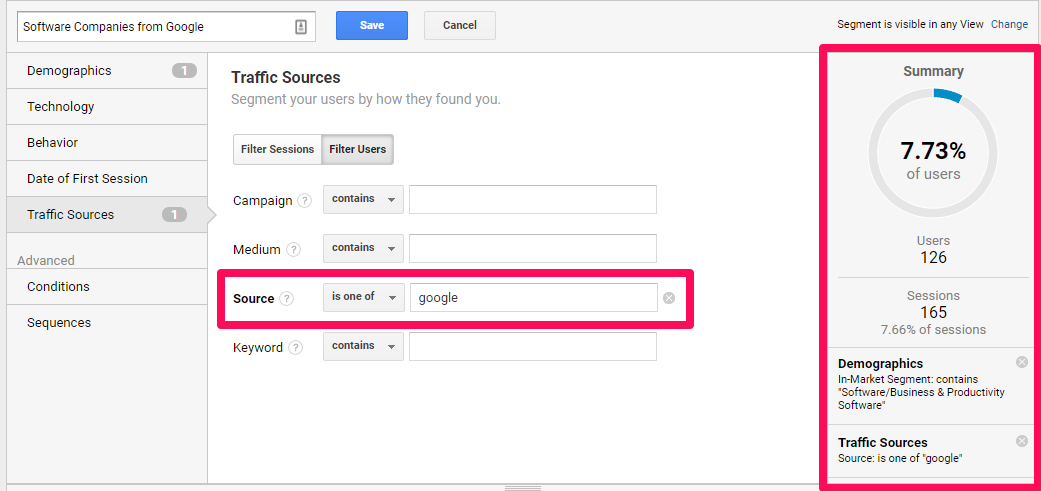
Followed by Traffic Source > Source (is one of) > Google. Once I’ve finalized my segment criteria, GA provides a summary with some preliminary metrics:
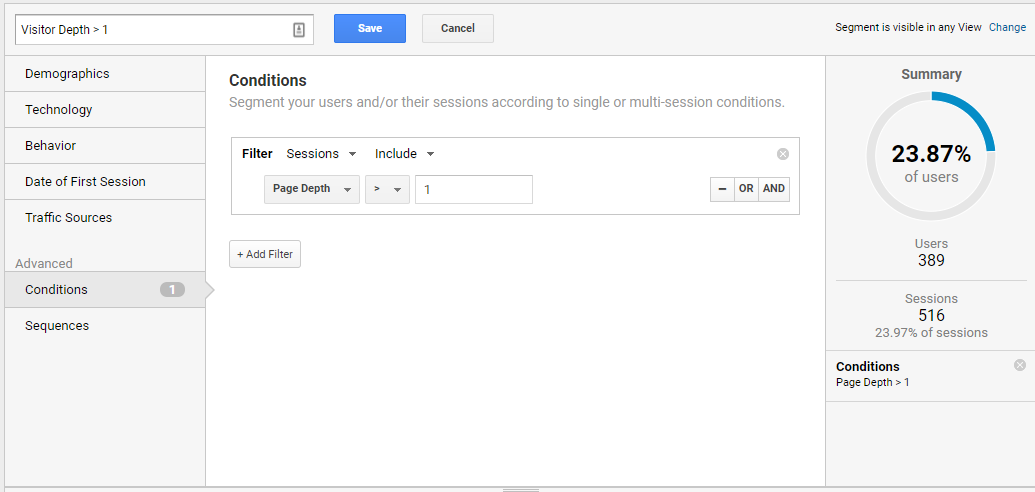
The conditions section takes this flexibility one step further. Let’s say I wanted to find out how many users view two or more pages during their visit. I would select “Page Depth” from the drop-down, followed by the “greater than” symbol, and then the number “1”:
I can add multiple conditions, as well as “and/or” statements, to dig deep into the data provided by GA. To apply your new custom filter, click the “+Add Segment” button, followed by “Custom,” and then select your new custom filter. You’ll see comparative metrics similar to before.
Want to get more advanced? Use Google’s Data Studio to further manipulate your reporting. This is especially useful for crunching all of your paid marketing data in one place.
Custom segments are an advanced feature, but as you can see, they are simple to set up. It all depends on how deep and granular you want to go with your data.
2. Advanced Dashboards
When looking for insights, visualization is key.
There are two ways to create a dashboard: build one from scratch or import a pre-existing one. Both have value, so let’s start by creating our own.
Creating Your Custom Dashboard
Let’s say you want to track various engagement metrics all in one place. In this example, we’re going to create three different widgets:
- Comparison of sessions to bounce rate
- Most visited pages
- Engagement metrics of top traffic sources
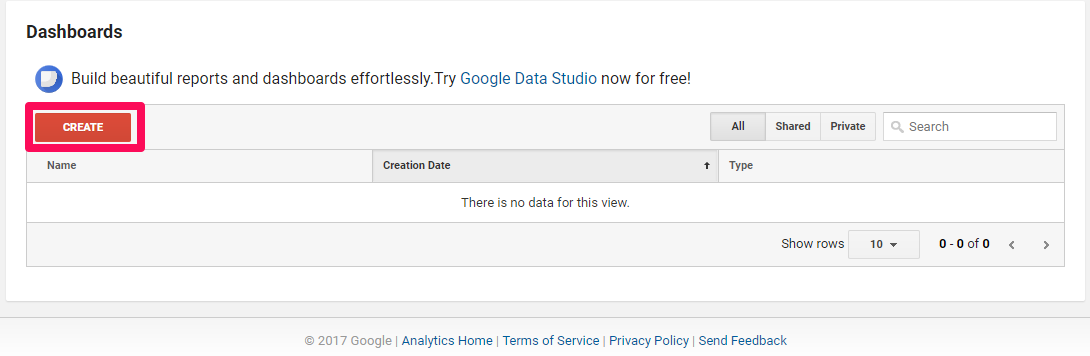
Start by heading to Customization > Dashboards and then click “Create”:
Select “Blank Canvas” and name your dashboard something meaningful. We’ll call ours “Engagement Metrics”:

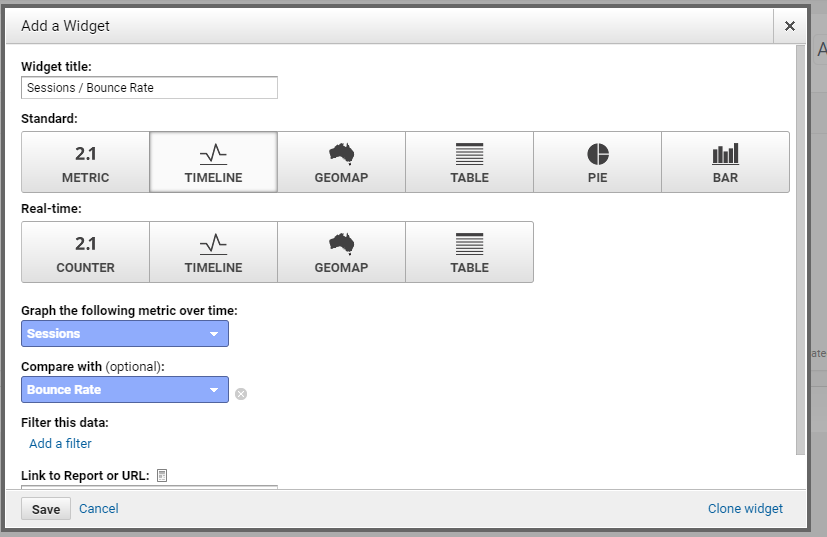
You’ll then see the “Add a Widget” dialog box. Our first widget will compare sessions to bounce rate. Here are the options we’ll select:
- Widget title: “Sessions / Bounce Rate”
- “Timeline” from the Standard section (this is where you’ll select how to visualize the data)
- Graph the following metric over time: “Sessions.”
- Compare with: Bounce Rate
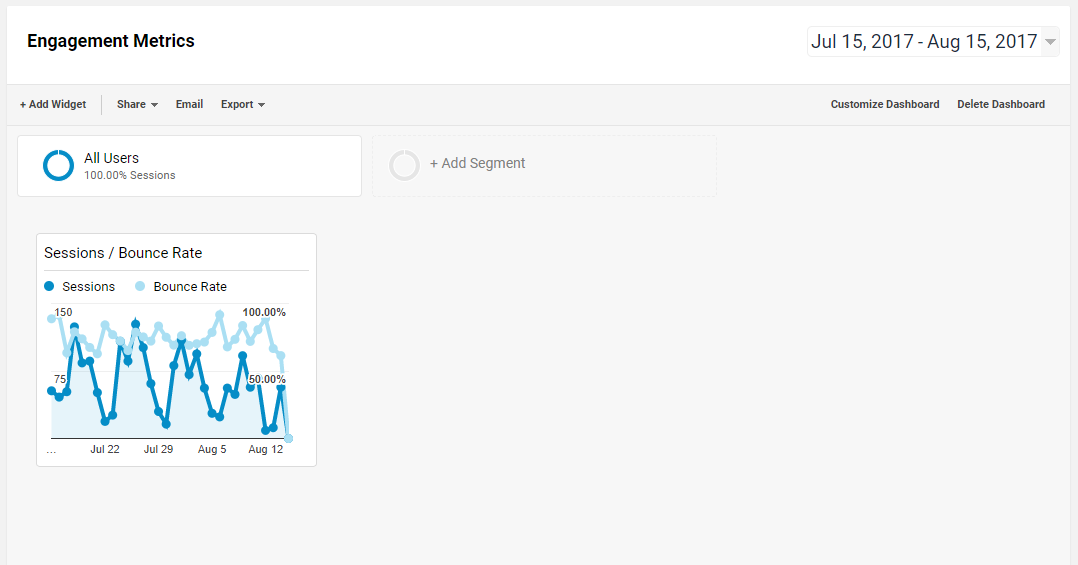
Our dashboard now looks something like this:
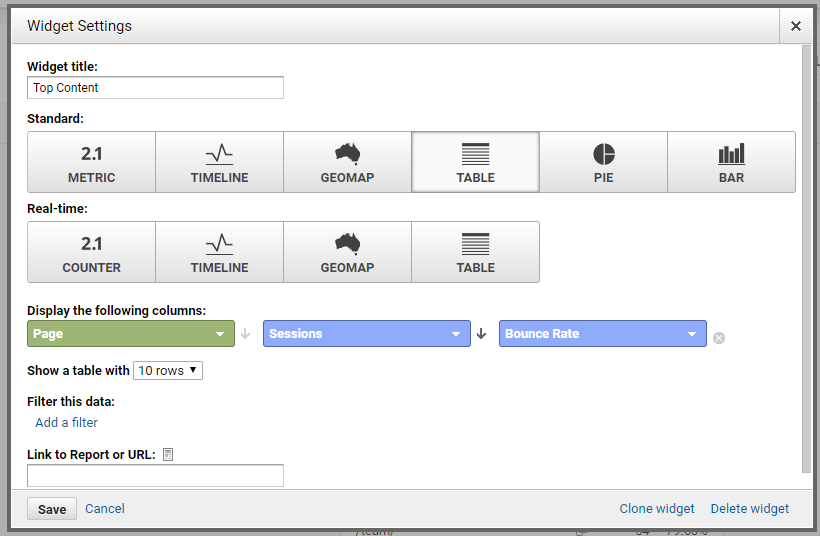
Now let’s create a list of most visited pages using a table:
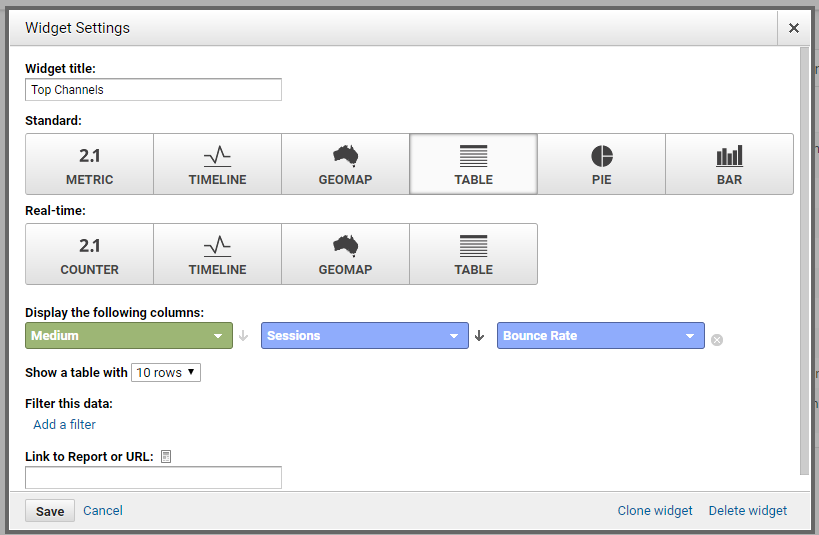
Followed by top traffic sources:
For good measure, I’m going to add some stand-alone metrics for deeper insight on this engagement dashboard. I’ll add sessions, bounce rate, and average time on page.
Finally, you can customize the layout of your dashboard using the “Customize Dashboard” button. Drag and drop the widgets to organize them any way you see fit. Here is an example of my final dashboard:
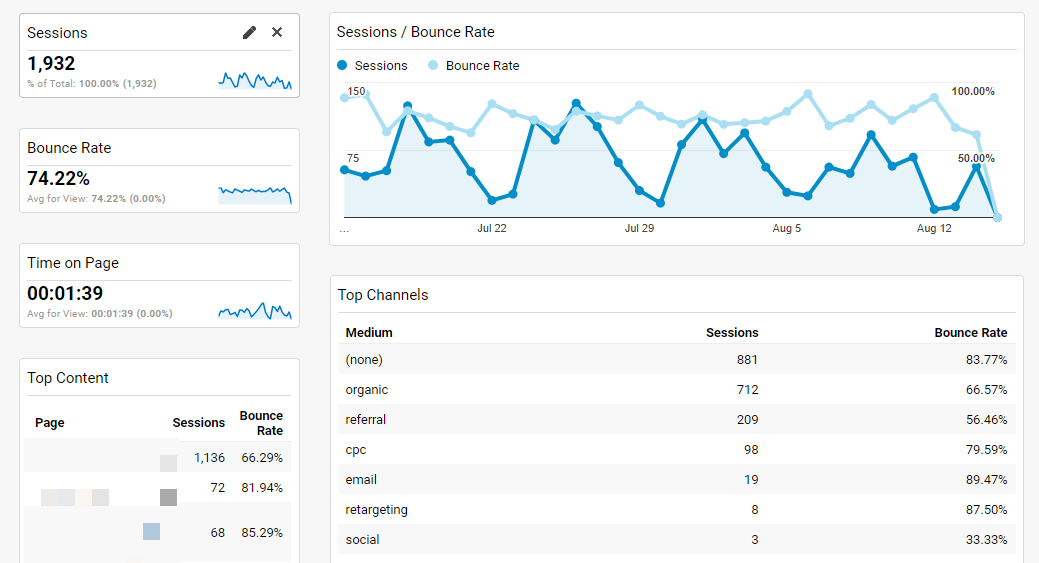
I used a 30 percent/70 percent layout, giving the graph more room to display data. The visualization is clearer and keeps snapshot data to the left.
There are many different ways to use dashboards. Analyzing certain demographics or traffic sources, for example.
However, it’s likely that someone else has already created a dashboard suited to your needs.
Great Dashboard Examples
Google has an entire gallery that hosts a huge number of dashboards you can import. To access it, create a new dashboard and click the “Import from Gallery” button. You should see a list that looks like this:
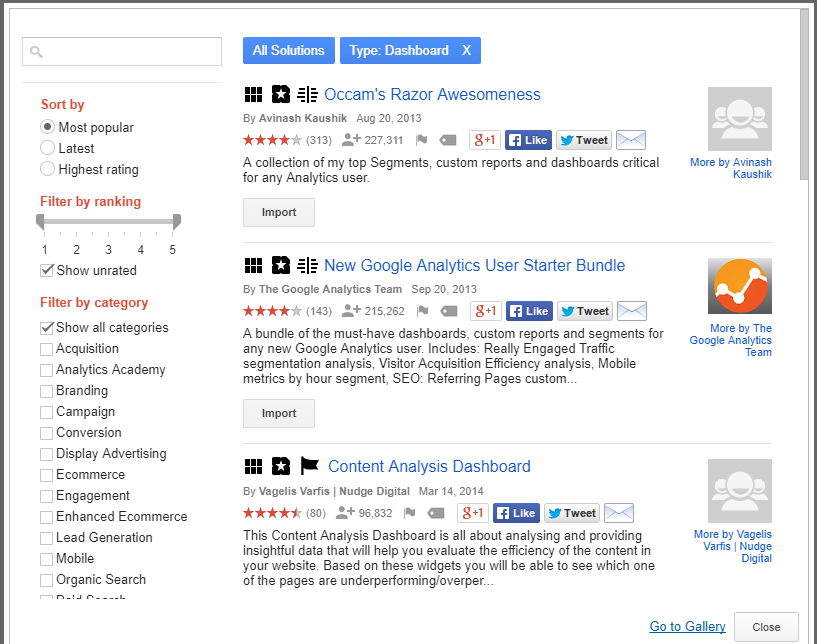
You can search for dashboards by keywords or use the filters to find them by ranking and category. For example, if I search for “social media traffic,” I see results ordered by popularity.
Here are five powerful dashboards you can import and use immediately.
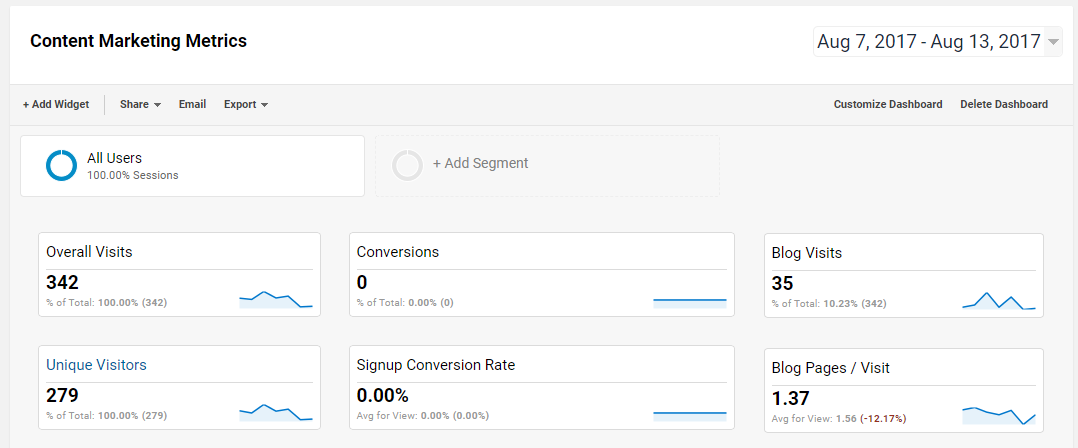
Content Marketing Dashboard
Get a complete overview of the performance of your content marketing efforts. For some widgets, you may need to change the “Page path level 1” filter to reflect your taxonomy.
Download the content marketing dashboard
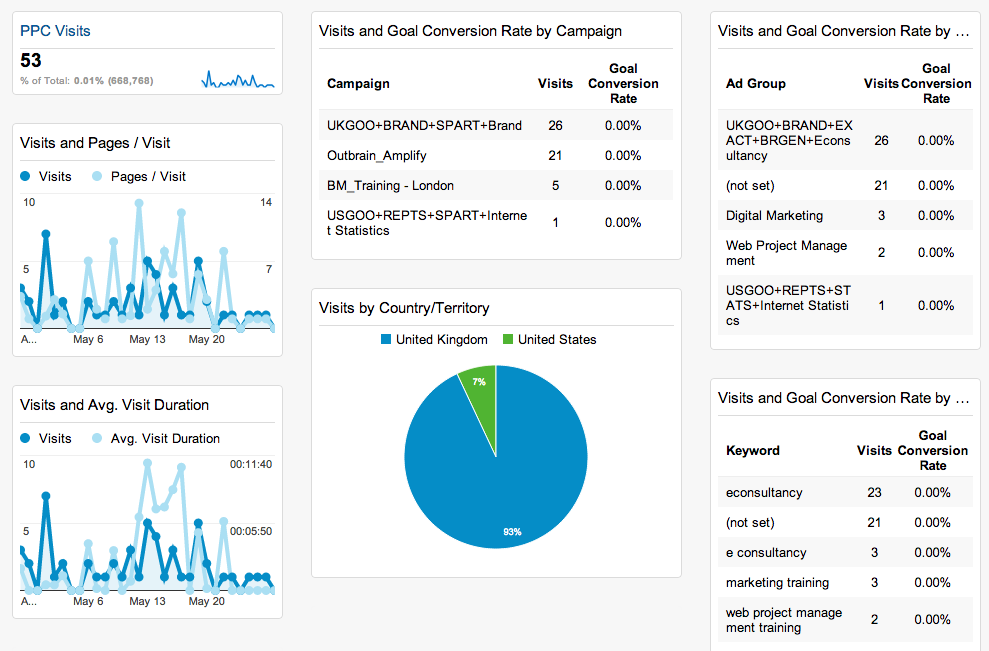
PPC Dashboard
If you’re pouring a lot of money into AdWords, this dashboard will give you insight on how paid traffic is performing at a high level.
Download the PPC dashboard here
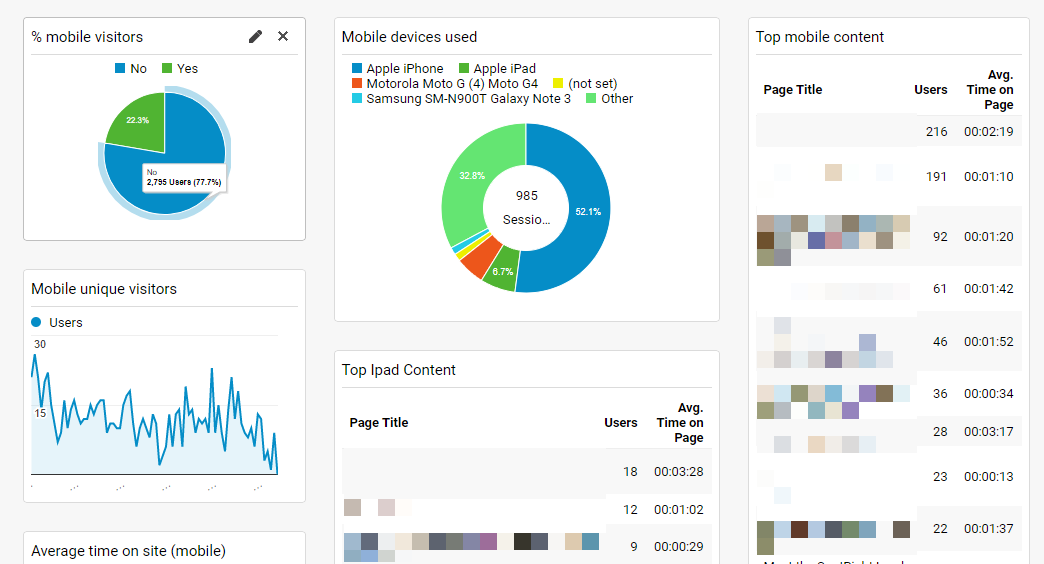
Mobile Dashboard
Device metrics are important when analyzing your site performance. Segmenting data by mobile users will show you if you need to optimize your site for mobile.
Social Media Dashboard
See how well your social traffic performs across your site and content, as well as what these users are worth to your business.
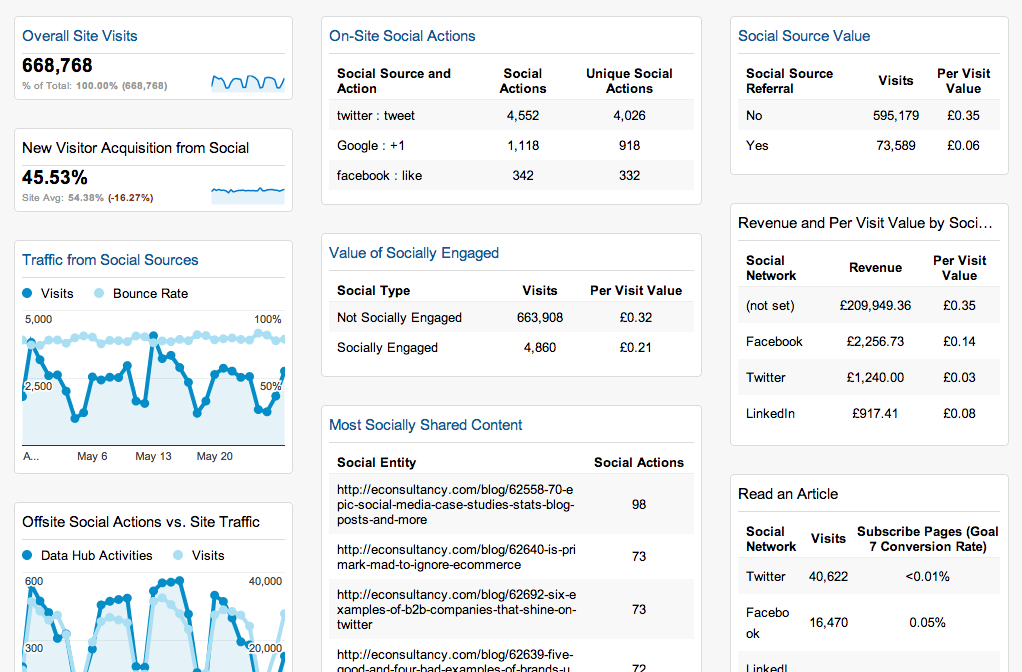
Download the social media dashboard
Site Performance Dashboard
It’s becoming more apparent that site speed is a major SEO ranking factor. Site speed also shapes the experience of your users. Keep an eye on your website diagnostics with this dashboard.
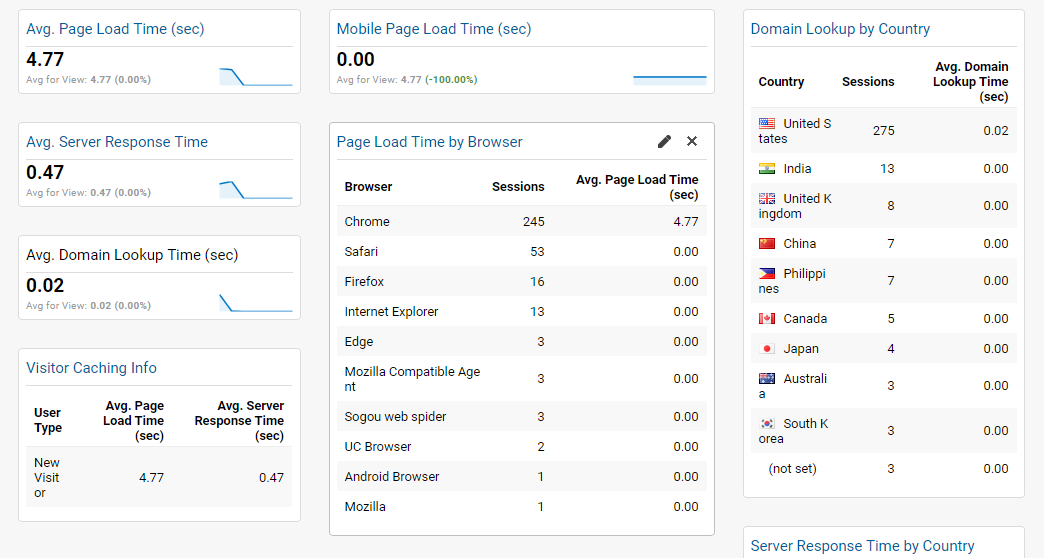
Download the site performance dashboard
Dashboards will help you monitor the metrics that matter. But this requires you to have these goals defined within GA in the first place. Let’s look at some advanced goal tracking features to ensure you’re getting the most out of your analytics.
3. Advanced Goal Tracking
As a marketer, you know the importance of measuring conversions over vanity metrics. Having your goals set up in Google Analytics is key. Without them, you won’t see how your visitors are interacting with your site. But most importantly, attribution of conversions will be nigh impossible.
While goals are compulsory, they can be limiting. They work by using specific “ending” URLs to a sequence of steps. For example, when someone fills a form to download a whitepaper or other lead magnet, they’ll be taken to a thank you page. Your goal will, therefore, look something like “http://www.yourdomain.com/thank-you.”
However, what do you do when you have a lead registration that involves several steps?
Multiple Goal Tracking
Goal tracking is limited and fairly linear. Use multiple goal tracking if you want to track a goal with several routes to completing it.
Let’s say you have several different email lists. There are many ways for users to opt-in, and each has their own goal (or thank you page). Creating multiple goals is one solution. Combining them into a single “signup” goal, however, is best practice, as it allows you to segment and measure data easily.
To do this, create a goal in Google Analytics as normal (by heading to Admin and selecting “Goals” under the View column). When you reach the Destination section, change the dropdown from “Equals to” to “Regular expression.” The text box (shown below) is where we’ll enter our multiple goal destinations.
The syntax for multiple destinations is: /(URL1|URL2)$
An example of the above syntax in action could be:
/(success|subscribed.html)$
![]()
Separate each URL using the pipe character (|), which acts as an “OR” statement. In other words, the goal counts if it matches either URL. The dollar character ($) declares the end of the expression.
Event Tracking (On-Page Interactions)
Goal tracking is invaluable for measuring which stage of a funnel your users have reached. But they’re limiting.
For example, let’s say you have several on-page interactions (lightboxes, welcome mats, and other AJAX-powered features). When completed, they won’t take the user away from the current page. So you need another way to track these interactions.
Which is where Event tracking comes into play.
An event essentially means “a click.” Whenever a user clicks on something on your website, that counts as an event. These can include file downloads, link clicks, and calls-to-action (handy for email subscriptions).
For example, let’s say one of your blog posts includes a content upgrade. When they click a link, a popup box appears where they enter their email address. They enter it, click the submit button, and the box disappears, allowing them to continue their reading experience.
Here, we see two events in action:
- Clicking the content upgrade link within the content
- Clicking the submit button within the popup box
To measure these on-page conversions, we need to use events. These are triggered using a piece of code, which looks like this:
_trackEvent(category, action, opt_label, opt_value, opt_noninteraction)
Let’s break down each part of the code, so you understand what each means:
- Category: Describes the event being triggered. This field is mandatory and should be named something meaningful to make tracking easier.
- Action: This describes the type of event, e.g., “click” or “optin.”
- Opt_label: This is just another label you can add. For example, if your category is “Subscription,” your opt_label could be “Content Upgrade.”
- Opt_value: Allows you to place a monetary value on the event. When doing this, be sure to exclude any symbols and use numbers only.
- Opt_noninteraction: Do you want this to affect bounce rate? If so, set to “true,” otherwise set to “false.”
Once you’ve created your code, you need to apply it to your hyperlink or submit button. We do this using the onClick attribute within the hyperlink’s code. Using hypothetical code, the link for our content upgrade looks something like this:
<a href=”#contentupgrade” onClick=”_gaq.push([‘_trackEvent’, ‘Click’, ‘light box’, ‘Content Upgrade’, 5, false]);”>Click here to download the bonus worksheet.</a>
If you’d rather not construct this yourself, you can use an event tracking code generator that SEO Weather created here.
With the right metrics, analytics can give you the insights needed to supercharge your B2B marketing. But there’s only so much you can do on the surface. Sure, GA is powerful, but you must dive deep to get the most out of it. By digging deep using the techniques in this article, you’ll gain granular insights into your user’s behavior faster.