E-commerce has always been a rapidly changing industry, and it’s never been more vital that we heed those changes. Four studies, in particular, stand out for their useful insight into where to take things from here. One benchmarking study tells us how our e-commerce sites stack up against the rest of the industry, and another reveals that obeying four simple rules can boost conversions by 25 percent.
With Amazon’s acquisition of Whole Foods and plans to invest in growing infrastructure, same-day shipping and free shipping are now expectations rather than privileges in the consumer mindset. AI marketing is starting to look feasible for enterprise businesses, and smaller businesses must consider how to prepare for and respond to these changes.
Let’s take a closer look at the research.
1. Wolfgang Digital 2017 E-Commerce Benchmark Study
Based on an analysis of 143 million sessions and $531 million in revenue, this Wolfgang Digital study reports some interesting correlations. It also provides some benchmarking you can use to compare yourself to others in selected industries and in the e-commerce industry as a whole.
Here are some of the standout results from that study:
- Email still absolutely stomps Facebook. As a final click, email delivers three times the revenue of Facebook.
- Out of all of the correlations studied, the strongest was between conversion rates and time on site—60 percent correlation.
- Google provides the highest converting traffic. The conversion rate for organic Google traffic was much higher overall than for other channels. High conversions and high organic Google traffic had a 48 percent correlation.
- The vast majority of e-commerce sites do not track offline conversions in Google Analytics—a staggering 99 percent.
- Direct traffic had a 35 percent correlation with higher conversion rates. The meaning of this isn’t necessarily clear. Much of this is returning traffic or traffic from people referred by word-of-mouth, but direct traffic includes all non-referrer traffic, including private browsing, app clicks, copy-paste, and so on.
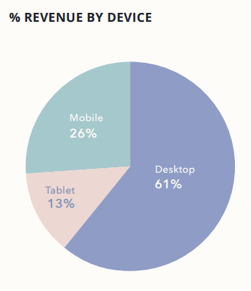
- Mobile revenue is growing, but desktop is still where most of the money is being made. Desktop is responsible for 61 percent of revenue. Even so, more sessions are taking place on mobile than on desktop for the first time ever: 52 percent.
- While mobile still isn’t the biggest source of revenue, sites that received more mobile traffic earned more money on average. The correlation between mobile pageviews and revenue was 25 percent.
- People shopping from tablets tend to buy more luxury items than people shopping from other platforms. The correlation for this one was 40 percent.
- If the ever-elusive, industry non-descript benchmark conversion rate is of interest to you, it is 1.6 percent for e-commerce sites.
- Site speed definitely plays a part. There was a 25 percent correlation inverse load time and site revenue, with average annual revenue increasing 10 percent for every 1.6 seconds of load time cut.
- The path from first-touch to purchase has grown in length, requiring 12 percent more clicks. Rumors of an ADD-riddled, technologically addicted society don’t seem to have dissuaded consumers from doing their research before making a purchase.
- Traffic that isn’t traceable using Google Analytics or other Analytics programs grew slightly from 17 percent to 18 percent. This is sometimes referred to as “dark traffic,” and includes visits from clicking links in text and chat apps, copying and pasting URLs, links from most apps, private browsing, and other miscellaneous linking without referrers.
- While absolute contributions from Google have grown, its share of contributions has dropped. In 2016, Google accounted for 69 percent of traffic and 67 percent of revenue. In 2017, this fell to 62 percent of traffic and 63 percent of revenue.
2. Emarsys and Forrester Consulting on AI Marketing
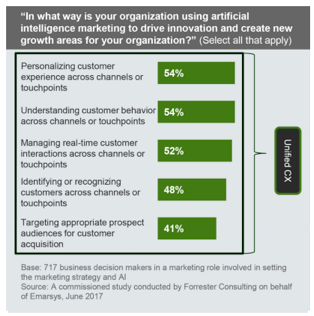
In July, Emarsys published a study they commissioned from Forrester Consulting. The purpose of the study was to investigate the gap between marketers’ interests in AI marketing technology and marketing tech professionals’ ability to meet those demands.
The study looked at businesses from the US, UK, Germany, France, and Australia, and considered businesses that made between $50 million and $5 billion.
Over 80 percent of the marketing decision-makers polled felt AI will soon play a part in boosting efficiency and efficacy, and that it would fundamentally change the industry. But 70 percent felt that their tech marketing professionals were currently up to the task.
What might be most interesting is that 78 percent of those polled said they plan to spend at least five percent more on AI marketing technology in the next 12 months. Even so, only 11 percent were considered to be ready for the approaching changes.
It’s hard to predict exactly how all of this will play out, which technologies will end up being most crucial, and how much of an advantage early investment will be later on in the game. Nevertheless, it’s clear “big data” and “machine learning” will transition from buzzwords to business practices in the near future.
With that in mind, e-commerce sites should, at a bare minimum, focus on building audiences and datasets and take the necessary steps to prepare for an even more personalized sales funnel.
3. Altman Vilandrie Study Identifies 4 Marketing Strategies That Boost E-Commerce Conversion Rates 25 Percent
In a study commissioned by Altman Vilandrie that looked at 190 B2B e-commerce sites, all of which made at least $100 million in revenue, the researchers identified four marketing strategies that boosted conversion rates by an average of 25 percent.

Despite this, only 15 percent of those interviewed were putting all of these strategies to use.
The strategies identified were:
- Standardized lead handoffs: Only 35 percent of the respondents said they had a standardized process for dealing with the transfer of leads from marketing to sales, even though doing so would increase conversion rates by an average of 13 percent to 17 percent. A standardized lead handoff identifies specific points where a lead transfers from marketing to sales, in a way that both departments are clear on, and that requires sales to followup within a specific amount of time.
- Lead scoring: 80 percent of the respondents were using lead scoring, but most weren’t taking advantage of automation. Lead scoring increases conversions by eight to 10 percent and shouldn’t be ignored by any e-commerce sites that leverage sales.
- Customer maps: Only 15 percent of the respondents regularly revisit their customer maps to get a clearer idea of their sales funnel and make sure it’s properly optimized. Reevaluating the customer maps often can boost conversion rates by three to five percent.
- Sales and marketing coordination: Only 55 percent of the respondents regularly see sales and marketing teams coordinate with one another. This is shocking when you consider this change boosts conversion rates by an average of six to seven percent.
4. Temando Study Shows Us E-Commerce Shipping Doesn’t Meet Buyer Expectations
Amazon is leading a shift in the way consumers expect online purchases to work. However, there’s a big gap between those new expectations and what many e-commerce sites are capable of providing.
The Temando State Of Shipping In Commerce study polled 270 small and medium-sized e-commerce businesses and 1300 consumers to identify what consumers expected and what small businesses were currently capable of.
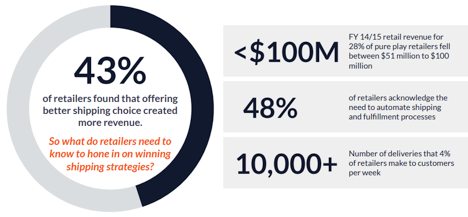
- Investing in shipping seemed to pay off. 50 percent of mid-market retailers saw an increase in sales after adding shipping choices. 43 percent saw a boost in revenue.
- 66 percent of shoppers feel shipping fees are unreasonably high and don’t reflect the shipping value.
- 65 percent would buy more to get free shipping, and $18 shipping is considered reasonable for same-day shipping.
- 40 percent of consumers expect Amazon Prime-esque memberships within a few years. However, only 25 percent of retailers are planning anything similar.
- The shipping situation for retailers is getting worse, with 29 percent offering same-day shipping, compared to 53 percent last year. After-hours delivery also fell, from 34 percent to 25 percent.
- 54 percent of shoppers abandoned their shopping carts as a result of shipping fees.
- 59 percent would go to a brick and mortar store if they considered the delivery fee unreasonable.
- Nearly half would abandon their cart if there weren’t any premium, fast delivery options.
- 100 percent of shoppers expect to get delivery date estimates, but only half of businesses provide them.
- 50 percent of shoppers wouldn’t bother with a retailer again if they had one negative shipping experience.
The one constant in e-commerce is the expectation of change. Be prepared for shifts in infrastructure, marketing automation, strategy, and ever-changing benchmarks.