![The Best Social Media Report Template for Social Media Managers [2021 Version] - SuperMetrics](https://www.convinceandconvert.com/wp-content/uploads/2021/07/The-Best-Social-Media-Report-Template-for-Social-Media-Managers-2021-Version.png)
Two of the most common questions we hear from our social media consulting clients are “what is the best social media report template?” and “what data points should my social media report include?”
I have an answer for you, plus get instant access to our free social media report template for social media and marketing managers. Let’s dive in now.
Why Our 6As Framework is The Best Social Media Report Template
There are hundreds, if not thousands, of data points to track social media activity performance across channels. Some metrics are better than others.
As any social media manager will know, it’s extremely cumbersome to take those numbers and make them meaningful, especially to someone outside of a social media team.
In order to move away from reporting on vanity metrics and instead create context around data points that are related to performance, we suggest utilizing our 6As social media reporting framework. You can access your own 6As template now.
The A’s framework places similar metrics together to help demonstrate overall campaign and initiative impact to the organization.
We believe it’s the best framework for social reporting across channels, especially for teams outside of the core social team.
This framework won’t show you granular things like Instagram likes — it gives you a much more useful overview of data points that are true indicators of performance.
What This Report Template WON’T Show (At Least Granularly)
- Impressions: Impressions give you an idea of reach and the fact that content is being delivered, but it’s not a good indicator of performance.
- Follower counts: you can have a bunch of followers (you can even buy them!), but if they’re not engaging with your content and following through with another conversion AFTER that engagement, that’s the point?
What This Report WILL Show You
In this social reporting framework, there are categories of types of data points. We bucket similar metrics for a comprehensive picture and to give you an idea of the audience across all of our social efforts.
You can see where things are going well and where things may need more attention.
Audience: Total subscribers, fans and followers, viewers, visitors and other addressable audiences. This is also where we recommend tracking an impression:follower ratio which will assist you in how your messages are being carried across your audiences.
Applause: Cumulative social reactions (likes, comments, story replies) that originate on owned content.
Amplification: Total shares of content, organic tagged mentions, branded hashtag use, user-generated content.
Attribution: Results of the audience taking a desired action through experience with content, such as link clicks, requests for information, subscriptions, form fills, app downloads, etc.
As a social media manager, you can use this social media reporting template to:
- Easily find issues and opportunities at a glance
- Report up to leadership and other teams on a consistent basis.
Supermetrics Makes Social Media Reporting Effortless and Effective
Here comes the challenge: How do you get all your social media data into the report?
Typically, you need to go through each social media platform and export a CSV file to your spreadsheets. It can easily take hours just to dig out the data you need. There’s little time for analyzing and optimizing your performance.
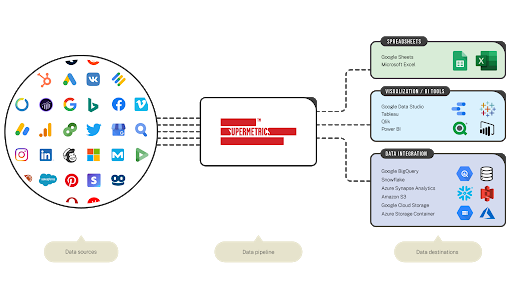
And that’s where Supermetrics comes in handy. Supermetrics helps you move data from different sources and build automated reports in no time.
Let’s take a closer look at what Supermetrics is all about and how you can benefit from the tool.
Supermetrics in a nutshell
Supermetrics is the market leader in marketing data delivery solutions. They help over half a million marketers and analysts move scattered data from marketing platforms such as Facebook, Instagram, LinkedIn, TikTok, etc. to their favorite reporting, analytics, and storage platforms.
If you’d like to hop on the Supermetrics train with data-driven companies like Shopify, L’Oreal, HubSpot, Nestlé, and Warner Bros, this is your chance.
So, how can Supermetrics help your companies grow with data?
Gain a complete understanding of your marketing performance
Now, I’ve been in the digital marketing field for ten years. My previous in-house role was Director of Marketing at the University of Michigan. To say we had “many” sources of data would be an understatement. It was tough to make informed decisions with scattered data.
Supermetrics helps you centralize all your data to create a single source of truth. This helps you build better attribution models and gain a holistic view of your marketing performance.
Spend time on what really matters
Rather than wasting hours manually collecting data from different sources, you can invest time and resources in activities that improve your ROI and drive better results.
And since Supermetrics works well with the reporting tools you already use and love — Google Sheets, Excel, Data Studio, Google BigQuery, etc. — you don’t have to spend time mastering another platform. As a result, the learning curve is much shorter.
Adapt to your data needs
You’d probably agree that your data needs are not static. For example, you can first store and analyze all your data in spreadsheets. As your business grows, your data grows. And when spreadsheets can no longer process your data, you may think about another solution like a data warehouse.
No matter where you are in your data journey, Supermetrics helps you keep up with the change and provides the solutions that suit your needs.

Here’s How to Access and Use Your Template
First, you need to install the Supermetrics add-on for Google Sheets.
To do this, open a fresh Google Sheet, then go to ‘Add-ons’ → ‘Get add-ons’ → ‘Supermetrics’ → ‘Install.’
Alternatively, you can also get Supermetrics from the Google WorkSpace Marketplace.
Here’s a quick tutorial on how to install the add-on.
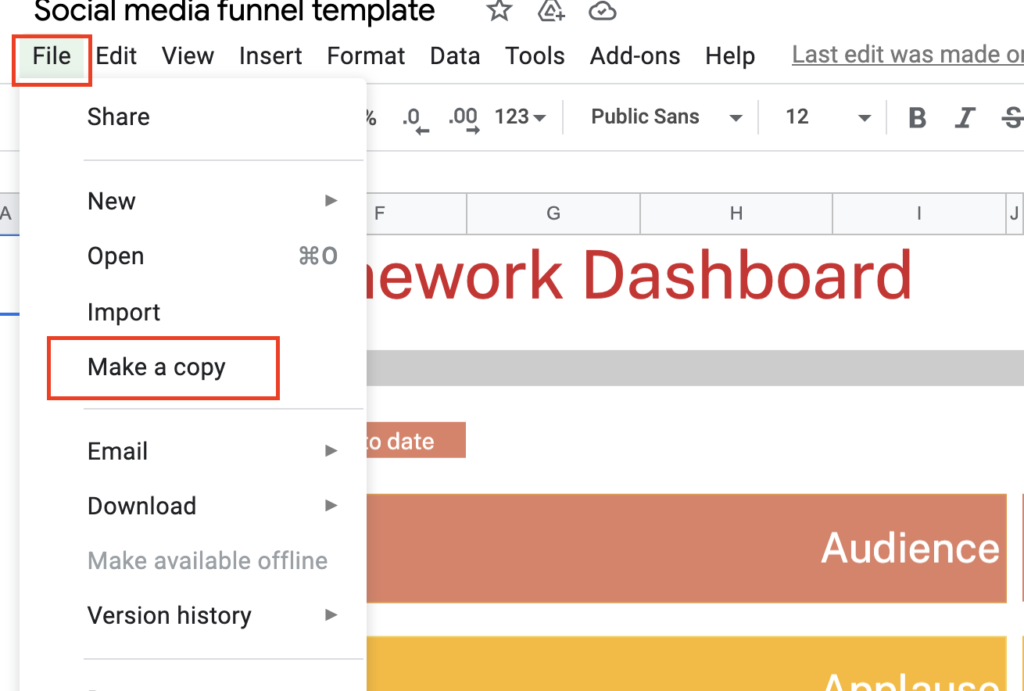
Next, make a copy of the template.
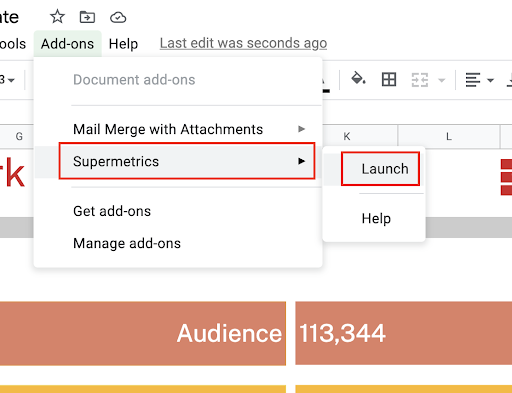
On your copied template, launch the Supermetrics sidebar. Click on ‘Add-ons’ → ‘Supermetrics’ → ‘Launch.’
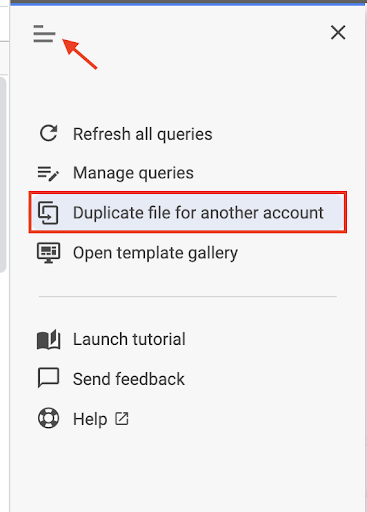
Once the sidebar opens, click on the hamburger icon and choose ‘Duplicate file for another account’.
Next, choose all the social media accounts you want to pull data from and click on ‘Duplicate the file.’

It may take a few minutes for Supermetrics to refresh your queries. After that, click on ‘here’ to open your report.
Here’s a quick tutorial on how to use Supermetrics templates for Google Sheets.
Psst! The Supermetrics team builds a lot of social media templates to help you kick start your reporting within minutes. You can find out more in their template gallery. Simply choose a destination — Google Sheets, Data Studio, or Excel — to get started.
Who Should Use This Report Template
This report template is made for social media managers that are part of teams or organizations that manage multiple social channels.
It’s also important to note that the social media team managing reporting should have access to Google Analytics and other data sources that show where macro and micro conversions are occurring.
How Often Should You Report on Social?
If you’re using Supermetrics or another social reporting connector, the report will automatically update itself.
Remember, it’s important to keep a close eye on your reporting because sometimes, data sources break. It happens to the best of us.
It’s also important to constantly review what’s happening. At the least, I would take a look at the report with your team at least once a week and take a look at your larger goals and KPIs at least once a month.
Final Words of Advice for Using This Template
Remember, there is no one, universal way to report social media. Social media reports should truly be specific to your organization and what you’re trying to accomplish.
This template is an excellent foundation to start with. Take it, customize it, and make it your own. And if you want to make your reporting painless, try Supermetrics. Don’t waste another second manually adding data to your dashboard.Also, consistency is key. If you always change the way you report or what you report, it only makes it harder to determine growth and where you can optimize. Any questions? Feel free to contact us now.