Customer service is being disrupted in the same ways that marketing has been disrupted: mobile, social, Millennial behavior shifts. We talk about marketing disruption A LOT. We talk about customer service disruption just a little.
As a result, most companies are using 1995 playbooks to solve modern customer service issues. We have to do better.
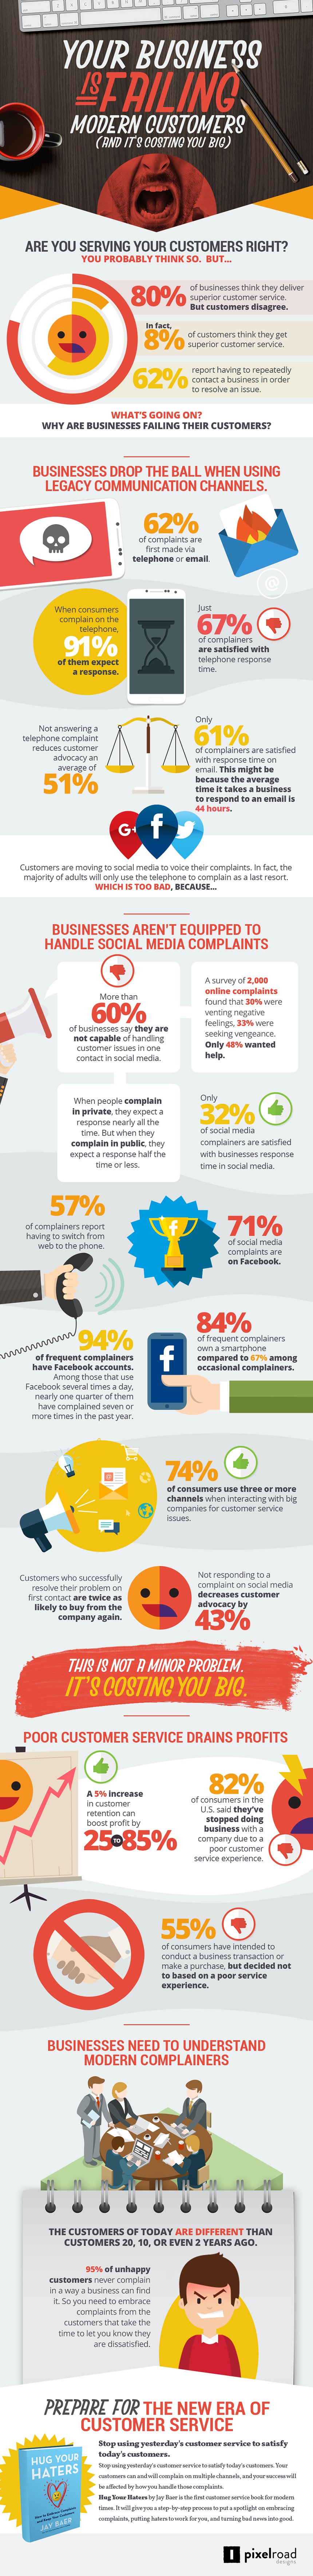
 This outstanding infographic that collects 23 statistics — many of them from my new book, Hug Your Haters – about why and how customer service needs to change NOW.
Here are the 23 Statistics That Show Why Customer Service Mostly Sucks in bullet point form, for easier tweeting. (just highlight the bullet to tweet)
(data with a ** is proprietary research I conducted with Edison Research exclusively for Hug Your Haters)
- 80% of business think they deliver superior customer service
- 8% of customers think businesses deliver superior customer service
- 62% of customers report having to contact a business multiple times to resolve an issue
- 62% of complaints are made first via phone or email **
- When consumers complain on the phone, 91% of them expect a response **
- Just 67% of complainers are satisfied with telephone response time from businesses **
- Not answering a telephone complaint decreases customer advocacy by 51% **
- 61% of people who complain via email are satisfied with businesses’ response time **
- Average time it take businesses to respond to an email complaint = 44 hours
- More than 60% of businesses say they are unable to solve social media complaints in one response
- Only 48% of online complainers are seeking help. The rest are venting, or seeking vengeance
- Only 32% of social media complainers are satisfied with businesses’ response time **
- 57% of complainers report having to switch from social media to phone to get problem solved
- 71% of all social media complaints are on Facebook (17% are on Twitter) **
- 94% of frequent complainers have a Facebook account **
- 84% of frequent complainers have a smartphone, compared to 67% among occasional complainers **
- 74% of consumers use three or more channels when trying to get help from big companies
- Customers whose problem is resolved in one try are twice as likely to buy from the company again
- Not responding to a customer complaint in social media decreases customer advocacy 43% **
- A 5% increase in customer retention can increase profits 25% to 85%
- 82% of American consumers say they’ve stopped doing business with a company due to poor service
- 55% of consumers have intended to make a purchase, but didn’t due to poor service
- 95% of unhappy customers never complain in a way a business can find the complaint