The existence of social media has gifted market researchers and insights professionals with a vast pool of data from which to pull information and insights. The emergence and progression of social listening has given us the ability to learn a lot about what an audience is discussing. Beyond what people are saying, what else can we learn about the people engaging in the conversation?
Listening lets us understand what people say about our companies, provide customer service, build brand communities, conduct competitive analysis, identify brand ambassadors, etc. It has also allowed us to gauge social visibility, brand sentiment, measure engagement and reach, understand the gender and location of those mentioning our name, and other social marketing measurements. This information can be leveraged in a lot of different ways to enhance the performance of your various marketing efforts.
A gap exists, however, in understanding who exactly is discussing the subject. As we are well aware, someone’s reasons for mentioning a brand, celebrity, or subject can be very different from the next person.
For instance, in the recent Presidential election, we saw that during the debates, the hashtag #TrumpWon started trending. Upon first glance, you might assume that it was mainly Trump supporters tweeting about this, with further analysis, it was discovered that it was mainly Hillary Clinton supporters using the hashtag satirically. This example highlights the need to understand the context of the conversation.
If you are listening to what people are saying without understanding the context, you may be receiving misleading data and insights. David Boyle, EVP Insight at BBC Worldwide, shared the following on the subject:
“A couple of years ago I was arguing that Twitter data was misleading and dangerous. I was speaking at market research conferences about how people using Twitter data to make business decisions are misleading their businesses. They are basing decisions off a tiny and unrepresentative subset of users that tweet about a given topic.”
Unfortunately, this same line of thinking has lead many market researchers and insights professionals to undervalue social data, specifically the insights that can be derived from social networks like Twitter. With such a rich pool of data and insights, it’s a waste to stop at what people are saying. The next level of insight innovation derived from social comes from understanding individuals in the context of their interests through the interest graph, following audience patterns.
What You’re Missing in Your Audience Analysis
If you head over to my Twitter feed, you’ll see tweets that align with my career. Aside from a few words in my bio, you would have no clue who I am or what I’m interested in outside of my career. However, if you look at who I follow, you’ll start to gain an understanding of who I am, what I’m passionate about, and what I value most. We only follow people, celebrities, and brands that we are interested in.
The key to incredibly powerful, naturally occurring, unbiased consumer insights is studying how people are connected by leveraging the interest graph. This adjustment in approach changes the game. As David said:
“I don’t think Twitter has changed. What’s changed is how we look at that data. We used to only be able to look at people who tweeted about, in the old days, music, which is an incredibly biased subset of people, leading to bad decision-making. Now, we can look at people who are interested in music (even if they never tweet about it), and we understand who those people are in much richer, more useful way, and it is incredibly powerful. All of this from data that was worse than junk—it was dangerous just three years ago. That’s an amazing opportunity. That’s an amazing turnaround.”
By analyzing and understanding audiences through their connections, we can gain powerful insights about an audience’s interests and what they care about most. This enables us to understand 100 percent of an audience, not just the vocal minority. As an example of intelligence-augmented listening, let’s look at the recent conversations around Black Friday.
What Social Listening Tells Us About #BlackFriday
Black Friday is going through an identity crisis. It’s no longer just Friday; it’s not even just Black Friday and Cyber Monday. It is major deals that appear after Halloween and continue into December. This change is mainly driven by large online retailers, such as Amazon, and it’s causing panic for the brick and mortar stores who rely on this annual event to kick off the holiday shopping season.
There have been several studies published to understand how Black Friday shoppers are changing and to see if there may be a “greying” effect to this once explosive annual sale. One of these reports, published by Brandwatch, presented information about people discussing Black Friday to reveal consumer preferences and product trends based on associated keywords. The study includes Twitter conversation around the Thanksgiving holiday shopping season, including Small Business Saturday, Cyber Monday, the general discussion around the intent to shop or purchase, and opinion-based conversations discussing some of the biggest brands and retailers in the market.
In their study, they reveal the top hashtags by volume of tweets, top hashtags by impressions, the volume of brand-related tweets, and the share of voice for brands and retailers, and they demonstrate the spike in conversation on Black Friday.
This type of information is useful for understanding engagement, reach, and share of voice for your brand. However, it doesn’t give us a clear idea of who’s discussing the subject. The only information it offers is gender and location breakdown. In today’s world, demographics and mention-based insights aren’t nearly enough to understand and relate to our audiences. We need to go beyond these basic metrics to understand what makes them tick.
What Interest Graph Analysis Tells Us About #BlackFriday
To augment the data and insights you can pull from social listening, let’s define an audience as anyone in the US who mentioned #BlackFriday in the month of November. During this period, there were 28,458 accounts that mentioned #BlackFriday at least once. By running an interest-based segmentation analysis on this audience using Affinio, we can see the breakdown of the audience based on shared interests.
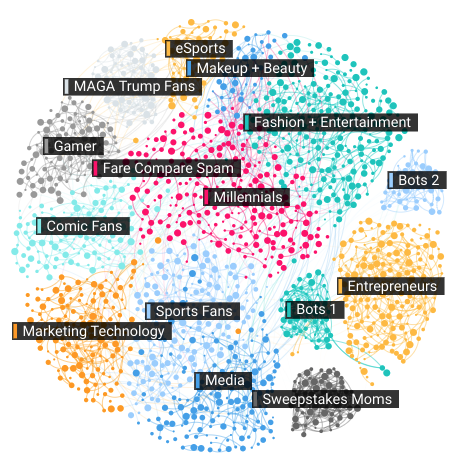
Moving beyond knowing how many people mentioned #BlackFriday, you now know who they are in the context of their interests. We can see that Fashion + Entertainment Fans, Millennials, Trump Fans, Marketers, Gamers, and more participated in the conversation.
It is notable that two of the clusters are bots. These are automated accounts that artificially inflate the conversation around the subject. Bots have been seen in many trending topics and events throughout 2016.
To understand which interest-based communities were most active in the conversation, we can see mentions of #BlackFriday by cluster.
Since the Fashion + Entertainment and Marketing Technology clusters were most vocal, let’s dive further into these communities to understand their interest in #BlackFriday.
Interests
When segmenting by following patterns, we’re able to determine what each segment (or cluster) is most interested in. Here are the most relevant accounts to the Fashion + Entertainment and Marketing Technologies clusters. This is what each cluster is most likely to be interested in.
As you can see, these two interest-based clusters differ quite a bit in their interests. While the Fashion + Entertainment cluster is most interested in celebrities like Ellen Degeneres, Jimmy Fallon, and Oprah, the Marketing Technology cluster is most interested in Elon Musk, Walt Mossberg, and Ann Handley. For media sources, the Fashion + Entertainment cluster look to InStyle, People, and ENews first, while the Marketing Technology cluster chooses TechCrunch, Fast Company, and Mashable first.
The way that you would relate to an individual in the Fashion + Entertainment cluster is much different than how you might relate to someone in the Marketing Technology cluster. While there are many differences among these communities, it’s important to know, as marketers and researchers, what brings them together.
[contextly_auto_sidebar]
Differences and Similarities
To understand the people in our audience further, we need to understand what makes them unique and what makes them similar. The following shows us the metrics that are unique to these clusters, and what brings them together.
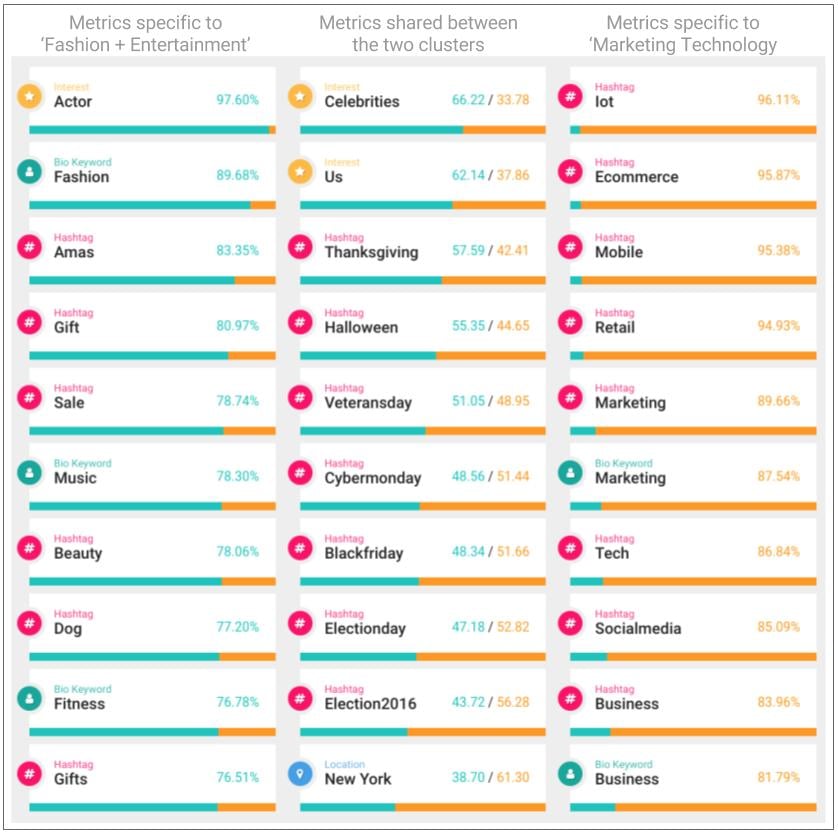
As you can see, not surprisingly, the Fashion + Entertainment cluster’s unique traits center around fashion, shopping, and entertainment, while the Marketing Technology cluster’s unique traits center around marketing, business, and innovation. Their interest in celebrities, conversations around Thanksgiving, the recent election, Veterans Day, and of course the Cyber Monday and Black Friday sales is where they share commonalities.
These augmented insights provide context to the “who” when understanding the market interested in #BlackFriday. Through their interest and passions, and an understanding of what makes these communities both unique and similar, we’re able to get a strong understanding of the culture of the communities within an audience. While understanding the impact of your marketing through engagement and impression metrics can give you an idea of reach, the most important metric is understanding who you reached—who is part of an audience.
How Interest-Based Segmentation Metrics Can Help You
As we’ve seen, interest-based analysis can give you a much better idea of who is in your audience. This understanding is critical, and it is just the beginning of what you can do with these insights.
Interest-based analysis takes social data beyond just social media. All of a sudden, by changing your approach to understanding the big data associated with social, you have insightful and actionable consumer insights. As Davis Boyle said, “That’s an amazing turnaround.”
To learn more about how you can pull augmented intelligence from your audience, check out this free eBook: Enhance Your Marketing Strategies with Enriched Cultural Data
Get more content like this, plus the very BEST marketing education, totally free. Get our Definitive email newsletter.