Guest post by Petri Darby, APR, the director of brand marketing & digital strategy for the Make-A-Wish Foundation of America.
In Douglas Adams’ “The Hitchhiker’s Guide to the Galaxy,” a computer known as Deep Thought spent seven and a half million years contemplating the great Question of Life, the Universe and Everything. Seventy-five thousand generations passed before Deep Thought revealed that the answer was “Forty two.”
Responding to the confusion and backlash of the crowd, the computer said, “I think the problem, to be quite honest with you, is that you’ve never actually known what the question is.”
The concept of “engagement” follows a similar storyline and is quickly becoming one of those words that makes you throw up a little in your mouth. Like “buzz,” “leverage,” “ROI,” and “word of mouth” before it, engagement has become the word du jour for marketers. But few are measuring it and most aren’t asking the right questions to define it.
Everyone wants to know what the magic metric or metrics are to track website engagement. But here’s the secret (and it’s not 42):
“THERE IS NO ONE METRIC OR SET OF METRICS THAT WILL WORK FOR EVERY ORGANIZATION.”
Sorry. It’s not that easy. And here’s why:
1. Your brand is different than every other company’s.
2. Your website is different than other websites.
3. Site visitors interact and transact differently with your company’s website than with other websites.
4. Different actions may represent bigger steps by a visitor toward a likelihood to buy or donate through your website versus others.
A Practical Case Study of Tracking Engagement
The Make-A-Wish Foundation of America’s engagement approach, metrics, and dashboard remain a work in progress, but I’m happy to share with you how we are approaching each of them. We do track our marketing and communications channels individually and in integrated fashions – this discussion is only about website engagement.
Our team spent several months talking about what engagement means to the Foundation and how to measure it. We define engagement, as it relates to our website, as the leading indicators of our ultimate success metrics. We define leading indicators as the short-term actions visitors take on our website that influence the longer-term business goals.
Our success metrics or business goals for the website center around:
• Donations
• Volunteers
• Wish referrals
Let me be clear – engagement is about the relationships that impact the return-on-investment (ROI) that your leadership cares about. Engagement, relationships, and ROI are not mutually exclusive and some relational efforts reap immediate rewards. But too many organizations only focus on immediate sales and donations. Engagement is often a courtship. It is not appropriate, nor advisable, to treat every channel solely as a direct response tool. When it comes to relationships, you earn your success over time.
You need to identify the short-term activities that impact longer-term business goals. We initially identified the following as possible influencers:
Visitor Loyalty: direct or bookmarked site visits (as opposed to visits from search engines or ads)
Subscriptions Initiated: email, print, and mobile signups through wish.org
Content Shares: pages, stories, videos shared to social networks or emailed from wish.org
Visitor Promotion: downloaded banners/badges or creation of personal fundraising pages
Page Views of Mission-Centric Content: wish stories and videos
Comments
We believe that this group of behaviors leads to other behaviors that are desirable at the financial, business level.
Other Possible Action Metrics We Discussed
Return visits initially seemed a logical metric to factor into the Visitor Loyalty category. About 75% of our site visits are by first-time visitors. However, better minds on our team pointed out that as a nonprofit, we need both loyal fans and new visitors – otherwise our donor acquisition pipeline dries up. Plus, the return visitor metric can be influenced by our social media efforts and other outreach and marketing campaigns. They didn’t disagree that return visitors are important – just that choosing whether the balance of return vs. new visitors is better or worse over time and assigning a value to one or both seems to muddy what felt like a clear measurement approach to this point.
We started integrating the Facebook “Like” button to pages and content on wish.org earlier in the year. We also recently added reaction buttons that visitors can use to indicate how a wish story made them feel – Hopeful, Reflective, or Inspired – and then post that reaction and link to their preferred social network(s). Both of those will be added to our pool of metrics soon.
Converting Actions Into Engagement Metrics
Stephen Hawking, the late Carl Sagan, and other physicists and cosmologists who have pursued a Theory of Everything – a set of rules that govern the activity of particles large and small throughout the universe – agreed that one criteria for judging the validity of such a theory is that it be simple. That being the case, surely measuring engagement on the Make-A-Wish Foundation’s national website, and your website, should follow that model.
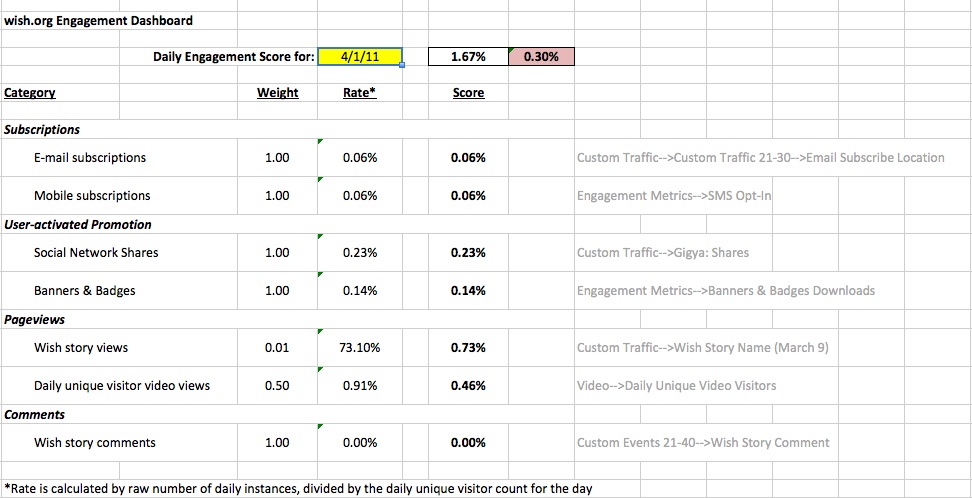
We calculate engagement rates for each individual activity as well as in an overall site engagement metric. Individual engagement rates are arrived at by adding up the daily instances of each action, then dividing it by the site’s total daily unique visitor counts. In some cases, we multiply that by a weighted measure to bring it to scale (again, for elegance and simplicity’s sake), and that gives us a score for each item.

To calculate the total site engagement rate, we apply those weighted averages to arrive at a total site engagement score for any particular period of time, whether a day, a month, or a year. In and of itself, this number is meaningless. It only is relevant when applied to a trend horizon to determine whether your engagement levels are moving up or down.
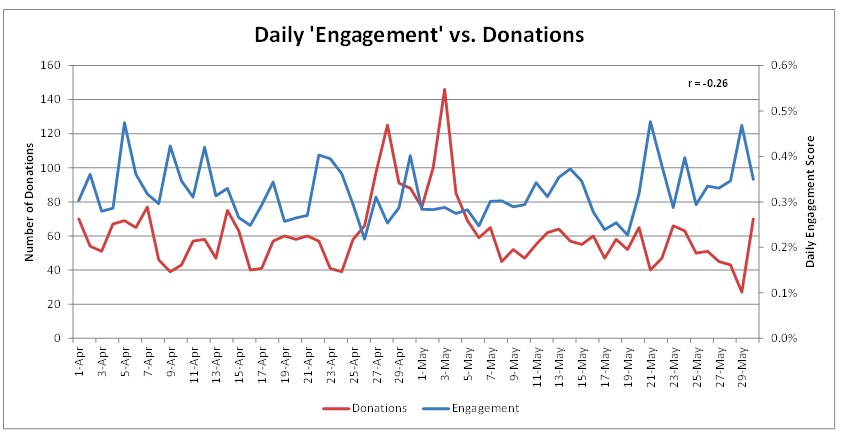
Now we can chart each site visitor activity and total engagement scores against our success metrics to identify whether there are clear correlations and which ones have little to no impact over time. This is the part that I like. While I love what numbers represent and the stories they tell, spreadsheets make my eyes crossed. I need a graphic – preferably popup books, but charts suffice too.
Remember, the goal is to track indicators that influence success over the longer term. If your overall engagement metric tracks almost one-to-one with your success metrics, then you may draw one of two conclusions, or both:
1. You haven’t effectively pinpointed your true leading indicators
2. You have effectively pinpointed direct response triggers (not a bad thing!)
When we charted individual actions – those for which we had historical data – against our success metrics, much to my surprise we found that direct/bookmarked visits actually had a reverse correlation, so we tossed those metrics.
When we first looked at a combined engagement score over a particular time period and charted it against online donations during the same period, we found a 74% direct correlation between the two. That seemed unusually high. Upon digging deeper, we realized that we were including in our counts those who opted into our email program during the donation process – so of course there was a correlation. Because we really wanted to isolate activities that were not directly tied to our business success measures – in this case donations – we realized we needed to filter better. We were able to segment all email subscriptions that came from anywhere on the site, except through the donation process, to come up with a more accurate measure.

We also decided to scrap print newsletter subscriptions because we could not effectively isolate those that occurred outside of the donation process and there is only one other page, which is not very popular, where they are offered on the site. I suspect we’ll drop more metrics and add others as we learn more going forward.
It’s not that the metrics we dropped hold no value – only that they do not fit within our definition of measurable website engagement.
We do not have historical data for some metrics, so we are applying them going forward. Like many charities, we receive a large percentage of our donations in December – usually the last few days. We believe that what we do the rest of the year helps determine the strength of our holiday donation revenues, so we plan apply our engagement statistics against our success metrics over the course of several months, as well as against our holiday numbers, to see if, and over what time span, they appear to have an impact.
Are We Headed Into a Wormhole Or A Black Hole?
Honestly, I don’t know where this exploration will lead and whether we will know more a year from now about what is driving what on our website. I am eager to hear your thoughts, even if you think we are going about this all wrong, and how you would approach it differently.
I am excited about the process and the conversations our team is having. And I think that Douglas Adams, Stephen Hawking, and Carl Sagan would be proud that we are at least asking the questions.

